The Data Download: End-of-Year Analytics to Drive Next Year’s Success
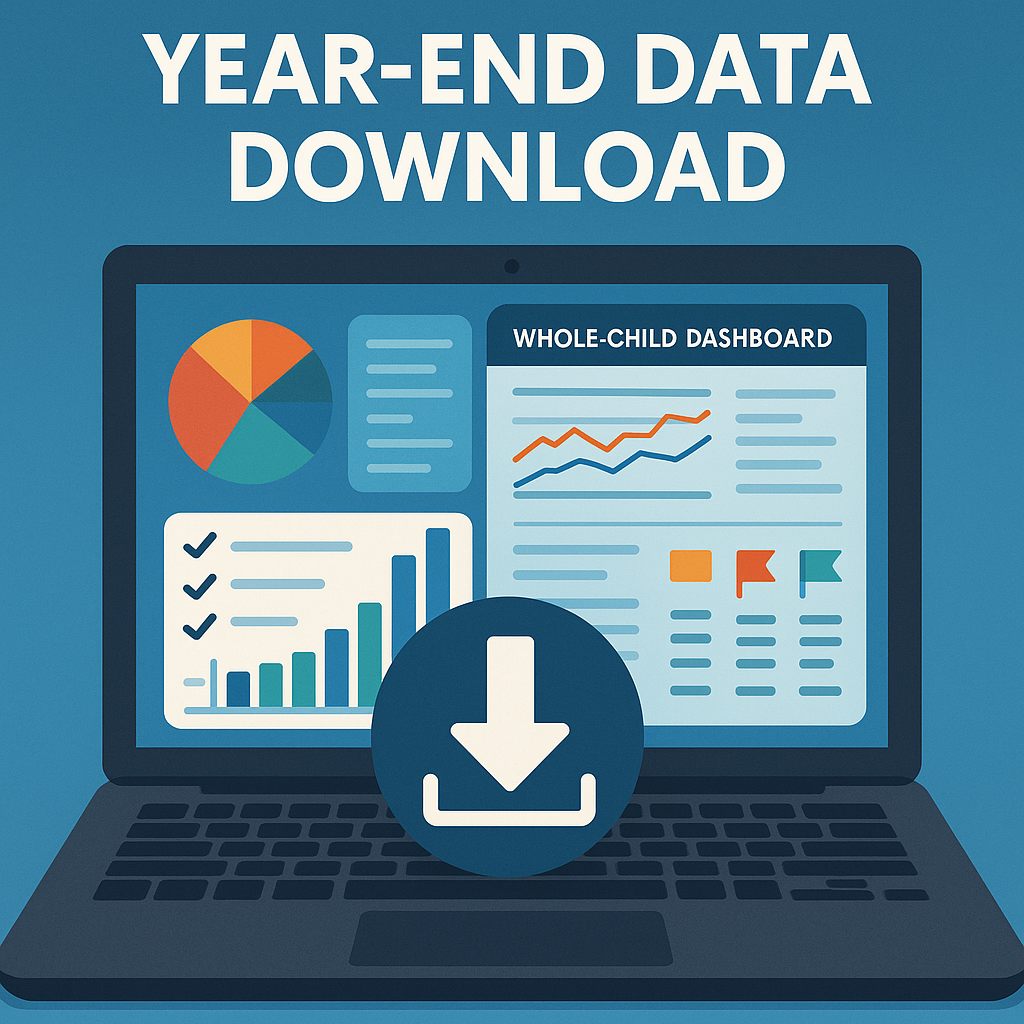
Before educators head out for summer break, it’s time for the year-end data download–a final review of six key analytics from this school year that will power next year’s success. From performance logs and attendance events to behavior flags, these downloads aren’t just metrics to archive; they’re the foundation for targeted interventions, precise goals, and an optimized back-to-school strategy. Let’s unpack the six essential downloads that will ensure you start next year with clarity, focus, and momentum.
Download #1: Building a “Whole-Child” Dashboard
When Compton Unified School District faced rising dropout rates, they discovered that disconnected gradebooks, attendance logs, and behavior reports hid critical warning signs. By developing a single analytics dashboard that merged these streams, educators could spot students whose attendance grades declined, months before they fell off track. Proactive summer outreach to those families reduced chronic absenteeism the following year (Compton LCAP Mid-Year Update).
Action Steps:
- Aggregate all end-of-year data – grades, attendance events,and behavior referrals – into one dashboard or report.
- Host a “data validation” session where teachers correct anomalies and confirm student profiles.
- Share access with counselors and specialists so every support team member sees the unified picture.
Download #2: Reflective Analysis: From Metrics to Mission
Across Texas, districts following the TEA Continuous Improvement Guide have turned data reviews into goal-setting engines. After mapping beginning-of-year targets against spring outcomes, teams gain clarity on what truly moved the needle, and what stalled progress. One district closed achievement gaps by 8% simply by realigning resources toward the lowest-performing standards (TEA Continuous Improvement Guide 2024–25).
Action Steps:
- Meet in grade-level or department teams for a two-hour data workshop.
- Center discussions around key questions:
- Which targets did we hit?
- Where did students struggle?
- What strategies do we deploy on Day 1?
- Record two or three SMART goals (e.g., “Raise 7th grade reading proficiency by 15% in the next three years”) in your school improvement plan.
Download #3: Pacing Insights: Front-Loading Remediation
After reviewing spring fluency assessments, many 4th-grade teams discovered that only 65% of students met benchmarks. Instead of waiting until October, they front-loaded targeted reading reviews in September, and saw fluency scores climb by 20% by December (ASCD instructional planning article).
Action Steps:
- Query mastery reports to identify specific standards with low proficiency.
- Adjust pacing guides: insert extra lessons on weak skills, and shorten review where students excelled.
- Build early formative “checkpoint” assessments into the first six weeks to verify remediation impact.
Download #4: PD Analytics: Professional Growth from Your Own Data
The Learning Policy Institute’s study on effective teacher development found that workshops anchored in a school’s actual performance gaps yield three times the practice change of generic PD. When a California district based its summer institute on its own literacy data, reading gains accelerated by 12% in the following semester (LPI PD report).
Action Steps:
- Identify two or three PD themes tied directly to your end-of-year analytics (e.g., differentiated math instruction, restorative classroom practices).
- Book summer or pre-service workshops with in-district coaches or vetted external experts.
- Schedule follow-up coaching visits to ensure teachers translate insights into daily routines.
Download #5: Transferring Student Insights
Chronic absenteeism jumped from 16% pre-pandemic to nearly 30% in the 2021–2022 school year, impacting over 14 million students. By sharing attendance flags, behavior trends, and learning profiles over the summer, one New Jersey principal cut first-quarter absences in half—simply by equipping incoming teachers with the right data (Attendance Works report).
Action Steps:
- Articulation Meetings: Schedule 15-minute huddles between current and next-year teachers to discuss each student’s strengths, challenges, and proven strategies.
- Student Profiles: Export concise, one-page summaries (reading level, attendance flags, behavior patterns) via your SIS.
- Vertical Team Sessions: Host a 30-minute cross-grade meeting (e.g., 5th → 6th) to align standards, share cohort trends, and co-plan supports.
Download #6: Roadmap Analytics: Closing the Improvement Loop
CASEL’s School Guide calls for an annual cycle of reviewing SEL data and immediately setting new targets to keep the momentum going. Schools that adopt this continuous loop report higher student well-being and a 10% boost in classroom climate measures (CASEL Action Plan guide).
Action Steps:
- Draft a one-page “Next Year Roadmap” that lists:
- Top two or three school-wide goals (e.g., “Reduce chronic absenteeism by 5%,” “Increase math proficiency by 12%”).
- Planned PD sessions and curriculum tweaks.
- Share the roadmap with all staff and schedule a mid-year check-in to measure progress and adjust strategies.
At Learn21, our goal is to partner with schools at every step of their data journey by providing expert guidance, tailored tools, and hands-on support so that analytics translate into real gains for students. By collaborating directly with educators, we make sure every dashboard and process we build addresses real classroom challenges and lightens teachers’ workloads rather than adding to them. Together, we’ll transform your year-end data download into a springboard for success. Now it’s your turn to hit “download” on next year’s success. Your upgraded playbook for student achievement is ready.
Media Literacy Minute
Is the Way We Talk About Misinformation Itself Misguided?
A provocative article from the American Enterprise Institute argues that much of the public conversation about misinformation has taken on a condescending tone, framing people as gullible rather than capable. The author criticizes “elite narratives” that suggest the public needs to be corrected rather than engaged—and suggests that media literacy efforts should focus less on gatekeeping and more on open inquiry, respect for agency, and intellectual humility. While not dismissing the dangers of misinformation, the article offers a fresh lens: are we empowering learners to think critically, or simply asking them to adopt our conclusions?
Understanding the Perception Gap
The Perception Gap project by More in Common uses 2019 data to explore the gap between what Americans actually believe and what people think the other side believes. Even though the data is a few years old, it remains a compelling illustration of how polarized media and social bubbles can distort our view of others. The site includes interactive graphs, key findings, and a Perception Gap Quiz that allows users to see where they stand. It's a thought-provoking resource for helping students reflect on bias, tribalism, and the influence of media narratives on civic understanding.
Checkology, created by the News Literacy Project, is a free e-learning platform designed to help students develop critical news literacy skills. Through interactive lessons and real-world examples, students learn how to identify credible sources, spot misinformation, understand bias, and recognize the role of a free press in democracy. The platform is student-friendly, standards-aligned, and includes educator tools for tracking progress and guiding discussion. Whether you're teaching current events or digital citizenship, Checkology is a valuable resource for building informed, thoughtful media consumers.
Beyond the Diploma: Microcredentials and Digital Badges for Graduates
As graduates step off the stage with diplomas in hand, a pressing question emerges: what’s next? In a workforce shaped by rapid technological change and shifting demands, a traditional high school diploma, while still important, often doesn’t tell the whole story of a student’s learning journey. That’s where microcredentials and digital badges come in: verifiable, portable signals of specific skills and competencies that help students stand out.
Unlike a diploma, which offers a broad summary of educational attainment, microcredentials zoom in on the details. They can represent technical skills,like proficiency in coding, data analysis, or welding, as well as soft skills such as leadership, collaboration, and problem-solving. These digital recognitions are frequently stackable, personalized, and aligned with real-world needs, making them a powerful bridge between classroom learning and career readiness.
More states are now recognizing microcredentials and digital badges not just as add-ons, but as legitimate components of graduation pathways. Several years ago, Ohio led the way by introducing industry-recognized credentials (IRCs) as alternatives to traditional exit exams. Students could earn points toward graduation by completing certifications like CompTIA, CPR, or credentials in cybersecurity, early childhood education, or medical assisting. Other states like Indiana, Colorado, New York, Texas, and Vermont have since followed suit, embedding microcredentials into their graduation policies and postsecondary readiness frameworks.
What’s driving this shift? A growing recognition that employers and colleges want more than a transcript. They want to know what students can actually do. Microcredentials meet this need by offering verified evidence of students' abilities. A Seal of Biliteracy, a badge for civic engagement, or a Google IT Support certification each tells a story that a diploma alone can’t.
However, the impact of microcredentials depends on quality and alignment. The strongest programs ensure that each credential maps to recognized standards or in-demand skills. Forward-thinking states are beginning to audit and refine their credential lists to prioritize rigor, relevance, and real-world value.
At Learn21, we’ve been closely tracking this evolution. Our edWise platform is designed to help districts manage the complexity of credentialing—tracking student progress, ensuring equity across subgroups, and aligning local programs with state requirements. It’s how we help schools move from policy to practice and ensure that every student’s story includes more than just a diploma.
As more states build digital ecosystems and credentialing frameworks, the message is clear: the future of graduate readiness is modular, personalized, and skills-based. Microcredentials don’t replace the diploma—they amplify it. They empower students to tell a fuller, richer story about who they are, what they know, and what they can do.
In today’s world, a diploma still matters. But what comes with it matters more than ever.
Big Ideas
Lab-Grown Nuggets Are Here
Scientists have successfully created chicken chunks the size of actual nuggets using cultured meat techniques. This “transformative” step could reduce the environmental impact of meat consumption and change how we think about food production. Would you take a bite of the future? Read more.
Tech Titans Call for a K–12 AI and Computer Science Revolution
More than 250 tech leaders, including execs from Google, OpenAI, and Microsoft, have signed an open letter urging policymakers to make computer science and AI education a national priority. According to TechSpot, they argue that these skills are essential for future jobs, innovation, and global competitiveness. What happens when the industry isn’t just hiring talent, but demanding what is built into the education system itself?
Biased Bots? AI Struggles With Fairness in Essay Grading
A new investigation reveals that popular AI grading tools not only fail to reliably assess writing quality—they also exhibit bias. The74’s report underscores a critical warning: AI is only as unbiased as the data it’s trained on. As we race to integrate AI into classrooms, how do we ensure we’re not embedding discrimination into our feedback loops?